Contact form
TRIC® V9 Modul: Zustandsgraph nach VDI 3814-6
With the help of the TRIC® module Status Graph, all operating states of a system are displayed graphically. It also illustrates the transition from the initial state to the target state.
- BricsCAD

General information on guideline VDI 3814
In 1977, VDI 3814 was drafted as the basis for building automation, which has been constantly supplemented ever since. Over the years, the VDI guidelines have been translated into an English version, for example, and their scope has been expanded from the former one sheet to six sheets. These sheets describe the basic principles and framework conditions of building automation.
The VDI 3814 series of guidelines applies to equipment, software and services for automatic control and regulation. In addition, the areas of monitoring, optimisation and operation are dealt with here. Furthermore, the management for energy-efficient and safe operation of the technical building equipment is also found here. The modules of control and regulation, monitoring and optimisation represent the elementary core of building automation and are based on the current state of the art.
VDI 3814 Sheet 6 (in future Sheet 4.4)
With the help of the state graph, all operating states of a system are graphically represented. It also illustrates the transition from the initial state to the target state. The conditions for this, as well as the respective actions of a state, are defined here. All control functions are found in the state graph and can be described via it.
In building automation (BA), the graphical representation of BA functions is a valuable support and is one of the most important aspects of planning. In the TRIC® module state graph, the creation of these graphs for the description of control functions according to VDI 3814-6 is therefore implemented in graphical form.
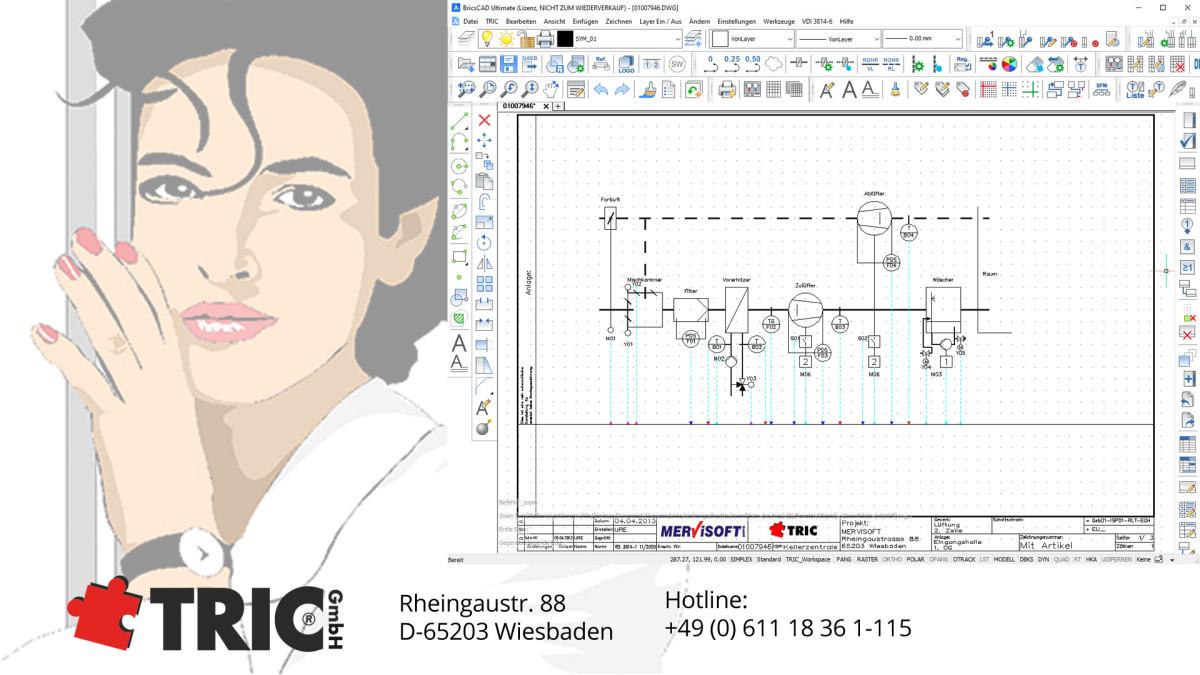
State graphs can be generated for one or more drawings of a plant and displayed graphically. This is done in editing via a convenient toolbar. Here, states, objects or pages can be inserted and edited with a mouse click.
It is also possible to create links, define transition conditions or set return markers.
About the software
With the help of the TRIC® module Status Graph, all operating states of a system are displayed graphically. It also illustrates the transition from the initial state to the target state.
Dynamic line linkage state graph
State graphs and their implementation have long been established and are an integral part of technology. Through dynamic line linking, all actuators and sensors are clearly linked to the automation diagram. The state diagram thus shows the devices with the state graph objects such as actuators, sensors and free texts. These can also be dynamically linked here in a further step.
If an individual modification has occurred during this step, this is added afterwards. If, for example, the user makes changes to the device identifiers, all these entries in the status diagram are automatically adjusted accordingly.
In addition, no matter where the object is located, it can be copied and stored in the block administration. In this way, state graph macros can be created that are used in the current processing, but can also be transferred to other automation schemes without any problems.
Of course, even after inserting a macro, all manually entered free texts for each unit are retained. In addition, there is also the option to subsequently reassign units in a new drawing. All state graphs can be created over several pages and can be output accordingly in print mode with the entire project.
Details
Compatibility
Version
V9Last Release
2023-04-03Language
GermanMedien(1)

Rating:
There are no reviews for this plugin.
